Viewing Device Status on Monitor Page
The Web interface's Monitor page provides basic status and information on the Device. The page is useful in that it allows you to easily obtain an overview of the Device's operating status at a glance.
|
➢
|
To view Device status and information on the Monitor home page: |
|
■
|
On the Menu bar, click Monitor or if you are already in the Monitor menu's Navigation tree, click  Monitor. Monitor. |
The Monitor page displays the following groups of information:
|
■
|
Top bar, displaying general device information:
|
|
●
|
Address: IP address of the Device's OAMP interface |
|
●
|
Firmware: Software version currently running on the Device |
|
●
|
S/N: Serial number of device |
|
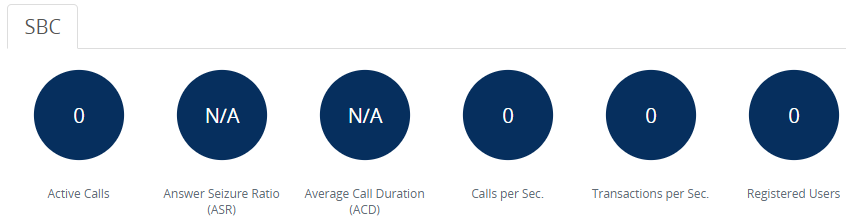
●
|
Active Calls: Displays the total number of currently active SBC calls. The corresponding SNMP performance monitoring MIB is acKpiSbcCallStatsCurrentGlobalActiveCallsIn.
|
|
●
|
Answer Seizure Ratio (ASR): Displays the number of successfully answered calls out of the total number of attempted calls. The corresponding SNMP performance monitoring MIB is acKpiSbcCallStatsCurrentGlobalAnswerSeizureRatio.
|
|
●
|
Average Call Duration (ACD): Displays the average call duration in seconds of established calls. The value is refreshed every 15 minutes and therefore, this value reflects the average duration of all established calls made within a 15 minute period. The corresponding SNMP performance monitoring MIB is acKpiSbcCallStatsCurrentGlobalAverageCallDuration.
|
|
●
|
Calls per Sec: Displays the total number of new calls per second (CPS).
|
|
●
|
Transactions per Sec: Displays the total number of new SIP transactions per second (out-of-dialog transactions such as INVITE and REGISTER, or in-dialog transactions such as UPDATE and BYE). The corresponding SNMP performance monitoring MIB is acKpiOtherStatsCurrentGlobalTransactionRate. |
|
●
|
Registered Users: Displays the percentage (%) of users currently registered with the Device out of the Device's maximum supported registered user capacity (regardless of any configurable limit). The corresponding SNMP performance monitoring MIB is acKpiOtherStatsCurrentGlobalRegisteredUsers.
|
|
■
|
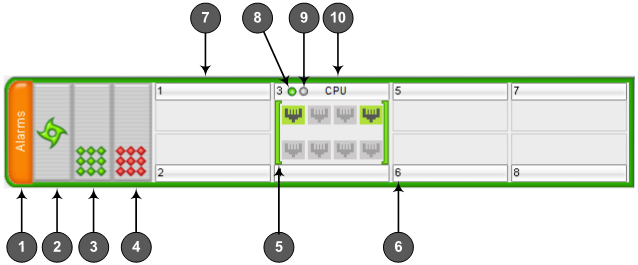
Graphical Display of Device: Shows color-coded status icons, as shown in the figure below and described in the subsequent table: |
Graphical Display of Device on Monitor Page - Mediant 2600 Enterprise Session Border Controller (E-SBC)
|
●
|
The figure above is used only as an example as the graphical display of your Device in the Web interface reflects your specific ordered hardware configuration. |
Description of Graphical Display of Device on Monitor Page
|
|
|
|
1
|
Alarms: Displays the highest severity of an active alarm raised (if any) by the Device:
To view active alarms, click Alarms to open the Active Alarms page (see Viewing Active Alarms).
|
|
2
|
Fan tray unit status icon:
|
■
|
 (green): Normal operation of Fan tray. (green): Normal operation of Fan tray.
|
|
■
|
 (red): Fan tray failure. (red): Fan tray failure.
|
To view detailed information of the Device's hardware components, click these icons to open the Components Status page (see Viewing Hardware Components Status.
|
|
3
|
Power Supply Module 2 status icon:
|
■
|
 (green): Normal operation of Power Supply module. (green): Normal operation of Power Supply module. |
|
■
|
 (red): Failure in Power Supply module or no Power Supply module is installed. (red): Failure in Power Supply module or no Power Supply module is installed. |
To view detailed information of the Device's hardware components, click these icons to open the Components Status page (see Viewing Hardware Components Status).
|
|
4
|
Power Supply module 1 status icon. For more information, see the description above.
|
|
5
|
Module status icon:
|
■
|
 (green): Module has been inserted or is correctly configured (green): Module has been inserted or is correctly configured
|
|
■
|
 (gray): Module was removed and "Reserved" is displayed (gray): Module was removed and "Reserved" is displayed
|
|
■
|
 (red): Module failure and "Failure" is displayed (red): Module failure and "Failure" is displayed
|
|
|
6
|
Chassis slot number.
|
|
7
|
Optional, Media Processing Module (MPM).
Note: This is a customer-ordered module.
|
|
8
|
OK LED icon:
|
■
|
 (red): Device undergoing startup. (red): Device undergoing startup.
|
|
■
|
 (green): Device startup has completed successfully. (green): Device startup has completed successfully.
|
|
|
9
|
Active LED icon:
|
■
|
 (gray): No High Availability (HA). This appears if the HA feature is not included in the installed License Key, HA is not configured, or upon HA initialization failure. (gray): No High Availability (HA). This appears if the HA feature is not included in the installed License Key, HA is not configured, or upon HA initialization failure.
|
|
■
|
(green): Applicable only to the graphical representation of the Active device in HA mode and means one of the following: |
|
✔
|
The Active Device is operating in Standalone mode (i.e., Redundant Device is missing and HA is unavailable) |
|
✔
|
The Active Device is operating in HA mode (i.e., Redundant Device exists and HA is available) |
|
■
|
 (yellow): Applicable only to the graphical representation of the Redundant device in HA mode and means one of the following: (yellow): Applicable only to the graphical representation of the Redundant device in HA mode and means one of the following:
|
|
✔
|
The Redundant Device is still synchronizing with the Active Device (i.e., HA is unavailable until HA synchronization finishes).
|
|
✔
|
The Redundant Device is operating successfully in HA mode
|
|
|
10
|
SBC module, providing the Ethernet port status icons:
|
■
|
 (green): Ethernet link is working (green): Ethernet link is working
|
|
■
|
 (gray): Ethernet link is not connected (gray): Ethernet link is not connected
|
To view detailed Ethernet port information, click these icons to open the Ethernet Port Information page (see Viewing Ethernet Port Information).
|